What is TM 21? How it is different from LM 80 and LM 79?
In this topic, we are going to discuss “What is TM 21”? “ How it is different from LM 80 and LM 79?”
LEDs are like other light sources, see their output decline over time. However, given the remarkably long life of LEDs and the absence of visible signs indicating their decreasing performance, it can be more complex to accurately measure and communicate light output over time. To help address this issue, the Illuminating Engineering Society of North American (IESNA) and the Environmental Protection Agency (EPA) have put in place standards for reporting the useful lifetime of an LED package: LM-80 (Measuring Luminous Flux and Color Maintenance of LED Packages, Arrays and Modules) and TM-21(Projecting long-term Lumen Maintenance of LED Light Sources).
TM-21 outlines a standard calculation method to predict future lumen depreciation using LM-80 data. These standards apply to lifetime projection of LED package, array or module alone.
TM 21 uses the below data of LM 80 for calculation (Lumen maintenance)
- Sample size and calculation data
- It is encouraging to adopt short interval and longtime data
- Two calculations:
- At the same burning conditions
- The temperature of the actual temperature testing point
- The calculation from the same burning conditions
- data collection and pre-processing
- calculation tool
- results
- same process at the different temperatures
- The calculation from the actual temperature testing point –
- The actual temperature is between two temperatures getting from the data, for example, let us have an Lm 80 data
 Lm 80 data[/caption]
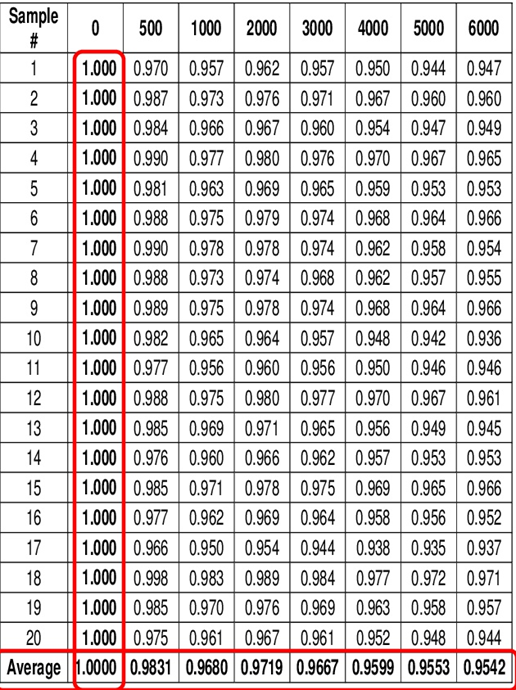
Step 1: Normalize and average all data
- Use all data
- LM 80 requires 6,000 hours with data at 1,000-hour increments
- TM 21 applies all the test data at any increment
- Normalize all data to 1 (100 %) at 0 hours
- Average each point for all samples of the device for each test conditions
- The average is done for the simplicity of the application
- Variance associated with multiple samples is not considered usable for projection.
Step 2 : Sample Size
[caption id="" align="alignnone" width="624"] Sample Size[/caption]
Step 3: Use the latest data for the curve fit

Step 4: Curve fit and projection

Step 5: Adjust results (X- times rule)
[caption id="" align="alignnone" width="623"]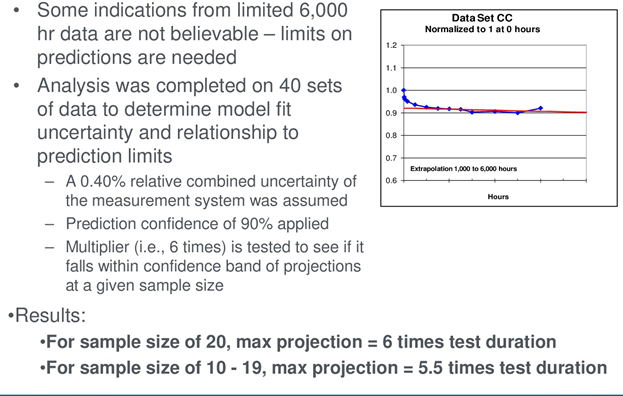 Adjust results (X- times rule)[/caption]
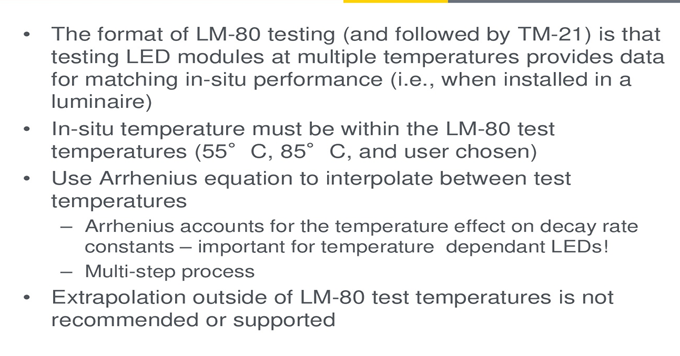
Step 6 Interpolation of the result
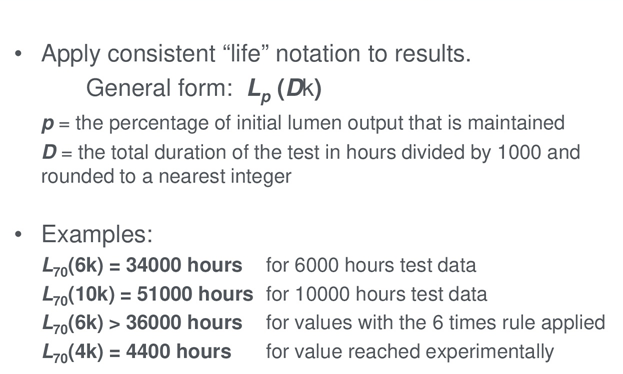
Step 7 Result reporting notation
ITC India Pvt Ltd is a NABL approved laboratory in Electrical, Electronics, and photometry with a huge scope in all the fields. Please visit www.itcindia.org for the scope.